
When a CFO or asset manager evaluates a new property management technology, the conversation almost always starts with the subscription line item. What will it cost per unit, per month, per portfolio? That question is easy to answer and easy to compare across vendors, which is exactly why it dominates so many buying decisions.
It is also the wrong starting point. Subscription cost measures what the organization spends, not what the organization gets back. A platform that costs more per unit but generates meaningfully more ancillary revenue and reduces liability exposure can produce a far stronger return than a cheaper tool that does neither. Evaluating proptech on cost alone is like evaluating a revenue-generating asset purely on its acquisition price technically simple, but financially incomplete.
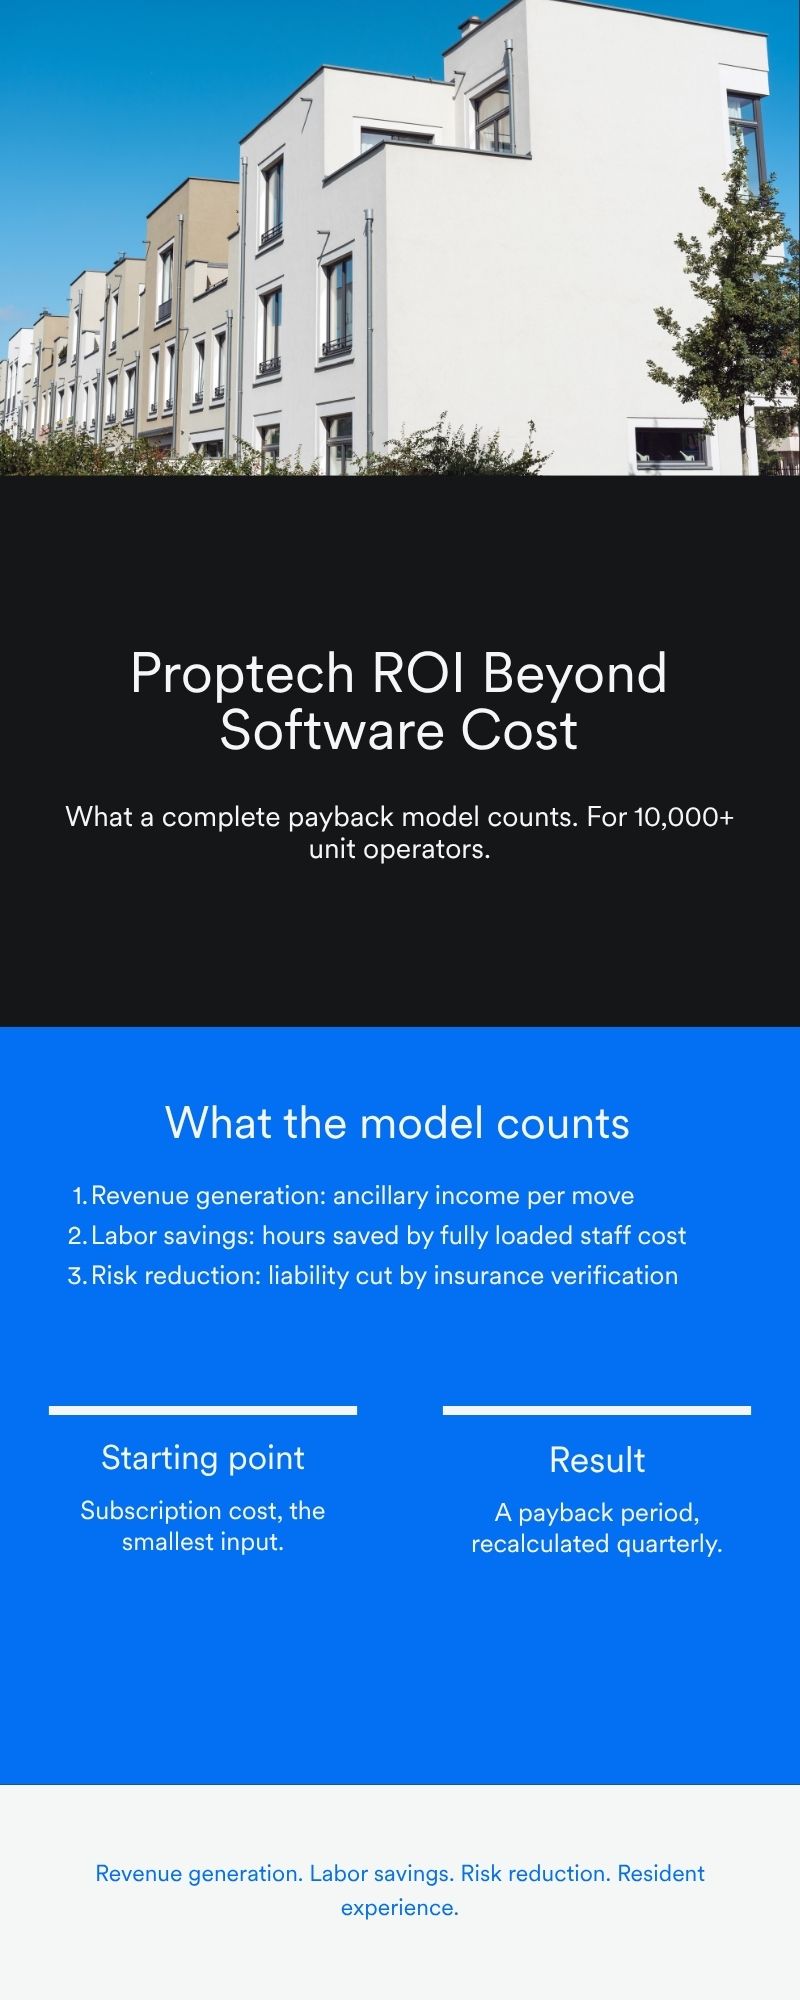
A complete ROI model for multifamily technology needs to account for labor savings, revenue generation, risk reduction, resident experience, and adoption rate, then roll all of it into a payback period leadership can actually use in a capital allocation conversation.
Why subscription cost is the wrong starting point
Subscription cost is a single, static number. ROI is a comparison between what an organization spends and what it gets in return, and for a move infrastructure platform, the return side of that equation is dominated by ancillary revenue and risk mitigation not by the software fee itself.
This is worth stating plainly because it changes how the evaluation should be framed internally. Rather than asking “what is the cheapest platform that meets our requirements,” the more useful question is “which platform produces the strongest net financial outcome once revenue capture and risk reduction are included.” Commercial structures across the proptech landscape vary widely flexible, revenue-aligned model options and partnership-based economics are increasingly common which means the sticker price alone rarely reflects the actual cost-benefit relationship an operator should be evaluating.
This distinction matters most at the point where a business case gets presented to an investment committee or ownership group. A subscription-cost comparison invites a simple question “why pay more for platform A when platform B is cheaper” that a revenue-and-risk-inclusive model can actually answer. Without that fuller model, finance teams are left defending a technology decision using only the weakest half of the financial picture, which puts otherwise sound investments at unnecessary risk of being rejected or delayed.
Labor savings
Labor savings are usually the first return-side line item finance teams reach for, because they are the most familiar to quantify. Manual move coordination chasing move-in dates, verifying documentation, coordinating vendors by phone or email consumes real staff hours that a structured workflow can reduce.
To estimate labor savings credibly, operators typically need three inputs: the average hours per move spent on manual coordination today, the fully loaded hourly cost of the staff performing that work, and the expected reduction in hours once the workflow is automated. Multiplied across annual move volume, this produces a defensible labor savings figure but it is important to treat it as one input among several, not the entire ROI case. Labor savings alone rarely justify a platform investment on their own; they are the operational efficiency layer, not the primary financial driver.
Revenue generation
Revenue generation is where the strongest ROI case is typically built, and it deserves to be modeled explicitly rather than treated as a vague upside. Every move-in and move-out is an opportunity to convert resident needs movers, packing, storage, insurance, utilities, and connectivity into structured ancillary income through the resident onboarding workflow, rather than letting residents source those services independently and capturing none of the value.
A defensible revenue model should estimate, per move: the percentage of residents who engage with each embedded service, the average revenue or commission generated per engagement, and how that figure scales across total annual move volume for the portfolio. Because this revenue is generated at every move, it compounds across a portfolio’s full unit count in a way that a one-time labor savings calculation does not. This is the primary reason revenue generation should be weighted more heavily than labor savings in an executive ROI model, consistent with a revenue-first evaluation of any move infrastructure investment.
It is also useful to break the revenue estimate down by service category rather than treating ancillary income as a single blended figure. Movers, packing, and storage typically represent the largest share of per-move revenue potential, with insurance and connectivity contributing smaller but still meaningful amounts. Modeling each category separately makes it easier to identify which service has the most room for improvement post-launch, and gives the ROI model a level of granularity that a single blended revenue assumption cannot provide.
Risk reduction
Risk reduction is harder to quantify than revenue or labor, but it belongs in the model because insurance and compliance gaps carry real, if irregular, financial exposure. A platform that verifies renters insurance automatically and enforces compliance at move-in reduces the property’s liability exposure in ways that are difficult to price precisely but are not difficult to estimate directionally.
A reasonable approach is to model risk reduction as an expected-value calculation: the estimated probability and average cost of an uninsured-resident liability event, multiplied by the reduction in that probability once automated insurance verification is in place. This will not produce a precise dollar figure, but it produces a defensible range that finance teams can weigh alongside labor savings and revenue generation, rather than leaving insurance risk out of the ROI conversation entirely.
Compliance-related risk deserves the same treatment. Fragmented, manually tracked move documentation makes it harder to demonstrate consistent policy enforcement across a portfolio, which becomes a liability in its own right during an audit, a legal dispute, or an ownership transition. Automated compliance enforcement reduces this exposure in a way that is easiest to express not as a hard dollar figure, but as a reduction in the frequency and severity of documentation gaps an operator would otherwise need to explain after the fact.
Resident experience
Resident experience does not show up on a balance sheet directly, but it influences two numbers that do: renewal rates and negative review frequency, both of which carry real financial consequences. A move process that feels disjointed separate emails for insurance, movers, utilities, and address changes creates friction at exactly the moment a new resident is forming their first impression of the property.
Operators building an ROI case should treat resident experience as a supporting variable rather than a headline metric: a modest improvement in renewal rate, attributable in part to a smoother onboarding experience, can be estimated conservatively and included as a small but real contributor to the overall return. It should not be the centerpiece of the model, but omitting it entirely understates the full financial picture.
The same logic applies to negative reviews and resident satisfaction scores, both of which increasingly influence prospective-resident decision making before a lease is ever signed. A disjointed move process is one of the more common sources of early-tenancy complaints, and reducing that friction has a downstream effect on marketing and leasing performance that rarely gets connected back to the technology decision that helped prevent it.
Adoption rate
Every ROI projection in this article assumes the platform is actually being used as designed and that assumption is where many models fall apart in practice. A platform projected to capture a given percentage of ancillary revenue per move will only hit that number if staff complete workflows correctly and residents engage with the services presented to them.
This means ROI should not be modeled as a single static projection. It should be modeled as a range tied to adoption rate, with a conservative case built on lower adoption and an optimistic case built on strong adoption. Tracking actual adoption rate post-launch and comparing it against the assumptions in the original ROI model is what turns a one-time projection into an ongoing accountability tool for both the vendor relationship and internal operations.
This is also where the earlier discussion of staff and resident adoption connects directly back to the financial model. Every input in the ROI calculation revenue per move, labor hours saved, insurance verification completion is only as accurate as the adoption assumption underneath it. A model built on optimistic adoption figures that never materialize will overstate the return regardless of how carefully the other components were calculated, which is why the conservative case deserves at least as much attention as the optimistic one when presenting the model to an investment committee.
Payback period
Once labor savings, revenue generation, and risk reduction are estimated, the natural next step is converting them into a payback period the point at which cumulative financial benefit equals cumulative platform cost. This is usually the single number that resonates most with finance leadership, because it translates a multi-variable model into one comparable figure.
| ROI component | Typical measurement basis | Weight in payback calculation |
| Revenue generation | Ancillary revenue per move × annual move volume | Primary |
| Labor savings | Hours saved × fully loaded staff cost | Secondary |
| Risk reduction | Estimated liability exposure reduction | Secondary |
| Resident experience | Renewal rate impact, conservatively estimated | Supporting |
A shorter payback period signals a lower-risk investment, which matters in capital allocation conversations where a proptech purchase is competing against other portfolio priorities for budget approval. Presenting a range rather than a single figure tied to the conservative and optimistic adoption cases described above gives finance leadership a more honest basis for that comparison than a single best-case number ever could.
Executive ROI framework
Bringing these components together into a single framework gives executives a model they can defend in a budget conversation, not just a vendor’s marketing claim. A practical framework includes:
- A revenue-generation estimate built from per-move ancillary income across movers, packing, storage, insurance, and utilities
- A labor-savings estimate based on documented current-state hours versus projected automated-state hours
- A risk-reduction estimate expressed as a range, tied to insurance verification and compliance improvements
- A conservative-to-optimistic range tied explicitly to expected adoption rate, not a single fixed projection
- A resulting payback period, recalculated quarterly against actual post-launch performance data
This kind of framework does more than justify an initial purchase decision. It gives asset managers and CFOs a structure for holding a platform accountable after launch, comparing actual ancillary revenue capture and risk reduction against the original model rather than assuming the projected numbers materialized simply because the software went live.
Building a model that reflects the full return
Subscription cost is the easiest number to compare across vendors, which is exactly why it is insufficient on its own. A complete ROI model for multifamily operators puts revenue generation and risk reduction at the center, treats labor savings and resident experience as real but secondary contributors, and ties every projection to a realistic adoption-rate range rather than a best-case assumption.
If your team is building a business case for a move infrastructure investment,reach out to the Moved team directly to work through a portfolio-specific ROI model that accounts for revenue capture, risk reduction, and adoption from day one.
Frequently asked questions
How do multifamily operators calculate proptech ROI?
Operators calculate proptech ROI by modeling revenue generation, labor savings, and risk reduction together, weighting revenue generation most heavily since it compounds across every move in the portfolio, then converting the combined estimate into a payback period tied to a realistic adoption-rate range.
What should be included in a property management technology ROI calculation?
A complete calculation should include ancillary revenue generation per move, labor savings from reduced manual coordination, an estimate of risk reduction from automated insurance verification and compliance, and a supporting adjustment for resident experience impact on renewal rates, all tied to expected adoption rate.
How do you measure software ROI in multifamily?
Software ROI in multifamily is best measured as a payback period built from multiple financial inputs revenue generation, labor savings, and risk reduction rather than a single subscription-cost comparison, and should be recalculated against actual post-launch adoption and revenue data rather than treated as a one-time projection.