Most multifamily leadership teams have strong visibility into financial performance and occupancy trends. Rent roll, delinquency, occupancy rate, and turn time all show up on a standard operations dashboard, reviewed monthly if not weekly. What rarely shows up on that same dashboard is how well the resident move process itself is actually performing and that gap is where real revenue and risk exposure quietly go unmeasured.
Occupancy tells leadership whether units are filled. Turn time tells leadership how quickly a unit gets re-leased. Neither metric says anything about whether a move-in converted into ancillary revenue, whether insurance was verified before the resident took possession, or whether staff completed onboarding tasks correctly and on time. A portfolio can show strong occupancy and still be leaving meaningful revenue on the table and meaningful liability exposure unaddressed, simply because no one is tracking the operational layer underneath the move event.
Why traditional KPIs miss resident operations
Traditional multifamily KPIs were built for a different question: is the asset performing financially at the portfolio level? Occupancy, turn time, and delinquency all answer that question well, and they should remain on any leadership dashboard. But they were never designed to answer a narrower, operationally specific question: is the resident move process itself the resident onboarding workflow performing the way it should at every individual property?
This distinction matters because move operations sit at the intersection of revenue generation, risk mitigation, and resident experience, none of which traditional occupancy-focused reporting was built to capture. A property can hit its occupancy target every month while still under-capturing ancillary revenue, under-verifying insurance, and burning excess staff hours on manual coordination and none of that will show up until it is measured directly. A resident operations KPI stack fills that gap by tracking the move process itself, not just its downstream financial outcome.
Task completion
Task completion measures whether the individual steps in a move workflow document collection, insurance verification, utility transfer, key handoff are actually being completed inside the platform, on time, rather than tracked informally or skipped entirely. This is the most foundational metric in the stack, because every other metric downstream of it depends on tasks actually being completed as designed.
Operators should track task completion at two levels: the percentage of moves with all required tasks completed on time, and the percentage of individual task types completed correctly across the portfolio. A property with a high overall completion rate but a persistently low completion rate on one specific task insurance verification, for example has identified a precise, addressable gap rather than a vague sense that “things are falling behind.”
Task completion also tends to be the earliest warning sign of workflow drift, which makes it worth reviewing weekly rather than monthly. A gradual decline in completion rate at a specific property, even a small one, often precedes a larger drop in ancillary revenue or compliance completion by several weeks, since incomplete tasks upstream mean fewer completed conversions downstream.
Engagement
Engagement measures whether residents are actively interacting with the move process rather than passively receiving it. A resident who opens a welcome email but never logs into the move portal has not truly engaged, even if that resident technically “received” every piece of onboarding communication.
Useful engagement indicators include portal login rate, percentage of residents who complete their profile or move details, and the percentage who view the embedded move-services screen. Engagement is a leading indicator for nearly every metric further down this list properties with low engagement rates tend to show weaker ancillary revenue conversion and slower task completion, since residents who are not engaging with the platform are also not completing the actions the platform is designed to prompt.
Engagement also varies meaningfully by move type. New move-ins tend to engage more readily than residents completing a move-out, since move-ins carry an obvious immediate need for services like movers, packing, and storage, while move-out engagement often requires more deliberate prompting. Segmenting engagement by move type, rather than reviewing it as a single blended figure, gives properties a clearer view of where engagement effort is best spent.
Move-event conversion
Move-event conversion measures how many of a property’s total move-ins and move-outs actually flow through the structured onboarding and offboarding workflow versus being handled manually, off-platform, or incompletely. A property can have strong task completion for the moves it tracks and still have a conversion problem if a meaningful share of moves never enter the workflow in the first place.
This metric matters because every move that bypasses the structured workflow also bypasses the revenue and risk-mitigation opportunities embedded inside it. Tracking move-event conversion alongside total move volume lets operators identify properties where staff are quietly reverting to manual processes for some portion of moves, which is often an early signal of the kind of workflow drift that erodes ROI over time.
Ancillary revenue
Ancillary revenue is the single most important metric in this stack, and it should be treated that way in how leadership reviews the KPI dashboard. This metric tracks the revenue generated per move across movers, packing, storage, insurance, utilities, and connectivity the services embedded directly into the move workflow.
Ancillary revenue should be measured per move, not just as a portfolio-wide total, so that properties can be compared on a like-for-like basis regardless of unit count or move volume. It should also be broken down by service category, since a property with strong overall ancillary revenue but weak insurance-verification-linked conversion has a different opportunity than one with strong insurance conversion but weak mover engagement. Leadership dashboards that surface ancillary revenue per move alongside occupancy and turn time give a far more complete picture of what a property is actually generating financially from its resident base.
It is worth resisting the temptation to report ancillary revenue only as a trailing quarterly total. Reviewed on a rolling monthly basis and compared against prior periods, this metric functions less like a report card and more like an early signal a property whose ancillary revenue per move is trending down, even before any other metric moves, is usually the first place worth investigating for an emerging engagement or task-completion problem.
Compliance completion
Compliance completion tracks the percentage of moves where required compliance steps most notably insurance verification were completed correctly and on time. This metric belongs directly beneath ancillary revenue in the hierarchy because it represents the risk-mitigation side of the same underlying workflow: financial upside on one side, liability exposure reduction on the other.
A property can have a high task-completion rate overall while still showing a lower compliance-specific completion rate if insurance verification in particular is being skipped or delayed. Tracking compliance completion as its own distinct metric, rather than folding it into general task completion, keeps liability exposure visible to leadership rather than buried inside a broader operational average.
Staff time
Staff time measures the hours frontline teams spend on move coordination, both inside the platform and through manual workarounds outside it. This is where the labor-efficiency layer of resident operations becomes visible, and it is a useful diagnostic metric even though it sits below revenue and compliance in overall priority.
A property showing high staff time per move alongside low task completion often indicates a workflow or training gap rather than simply a busy team staff may be duplicating effort between the platform and a shadow tracking system. Comparing staff time per move across similar properties can surface which locations have genuinely streamlined their process and which are still absorbing unnecessary manual overhead.
Resident response time
Resident response time tracks how quickly residents move from an initial onboarding prompt to completing the associated task submitting insurance documentation, confirming a move date, or engaging with an embedded service offer. Slow response times often correlate with poor timing or framing in how the request was presented, rather than genuine resident disengagement.
This metric is particularly useful for diagnosing conversion problems in ancillary revenue and compliance completion. A property with strong overall engagement but slow resident response time on insurance verification specifically, for example, may need to adjust when and how that request is surfaced in the resident’s move timeline rather than assuming the process itself is fundamentally broken.
Transfer activity
Transfer activity tracks move-related actions tied to utility transfers, address updates, and similar administrative steps that accompany a move-in or move-out. While these tasks are administrative rather than revenue-generating on their own, tracking them matters because the SOP’s moving-services priority rule applies here directly: whenever administrative activity like this is discussed, movers, packing, and storage should remain part of the same narrative rather than being treated as a separate, lower-priority category.
In practice, this means transfer activity should be reviewed alongside not instead of ancillary revenue and compliance metrics, reinforcing that administrative move tasks are one part of a broader revenue-and-risk-generating workflow rather than a standalone operational checkbox.
Portfolio benchmarking
Portfolio benchmarking brings all of the preceding metrics together by comparing performance across properties rather than reviewing any single property in isolation. A metric like ancillary revenue per move means far more when compared against a portfolio average or against similar properties than it does as a standalone figure.
| Metric | What it reveals when benchmarked |
| Ancillary revenue per move | Which properties are under-capturing available revenue |
| Compliance completion rate | Which properties carry disproportionate liability exposure |
| Task completion rate | Which properties have workflow or training gaps |
| Staff time per move | Which properties are absorbing unnecessary manual overhead |
| Move-event conversion | Which properties are bypassing the structured workflow entirely |
Benchmarking is also what turns this KPI stack from a reporting exercise into an operational tool. Leadership can direct attention and resources toward the properties with the largest gap between actual and portfolio-average performance, rather than spreading oversight evenly across a portfolio where performance is, in reality, highly uneven.
Building the dashboard
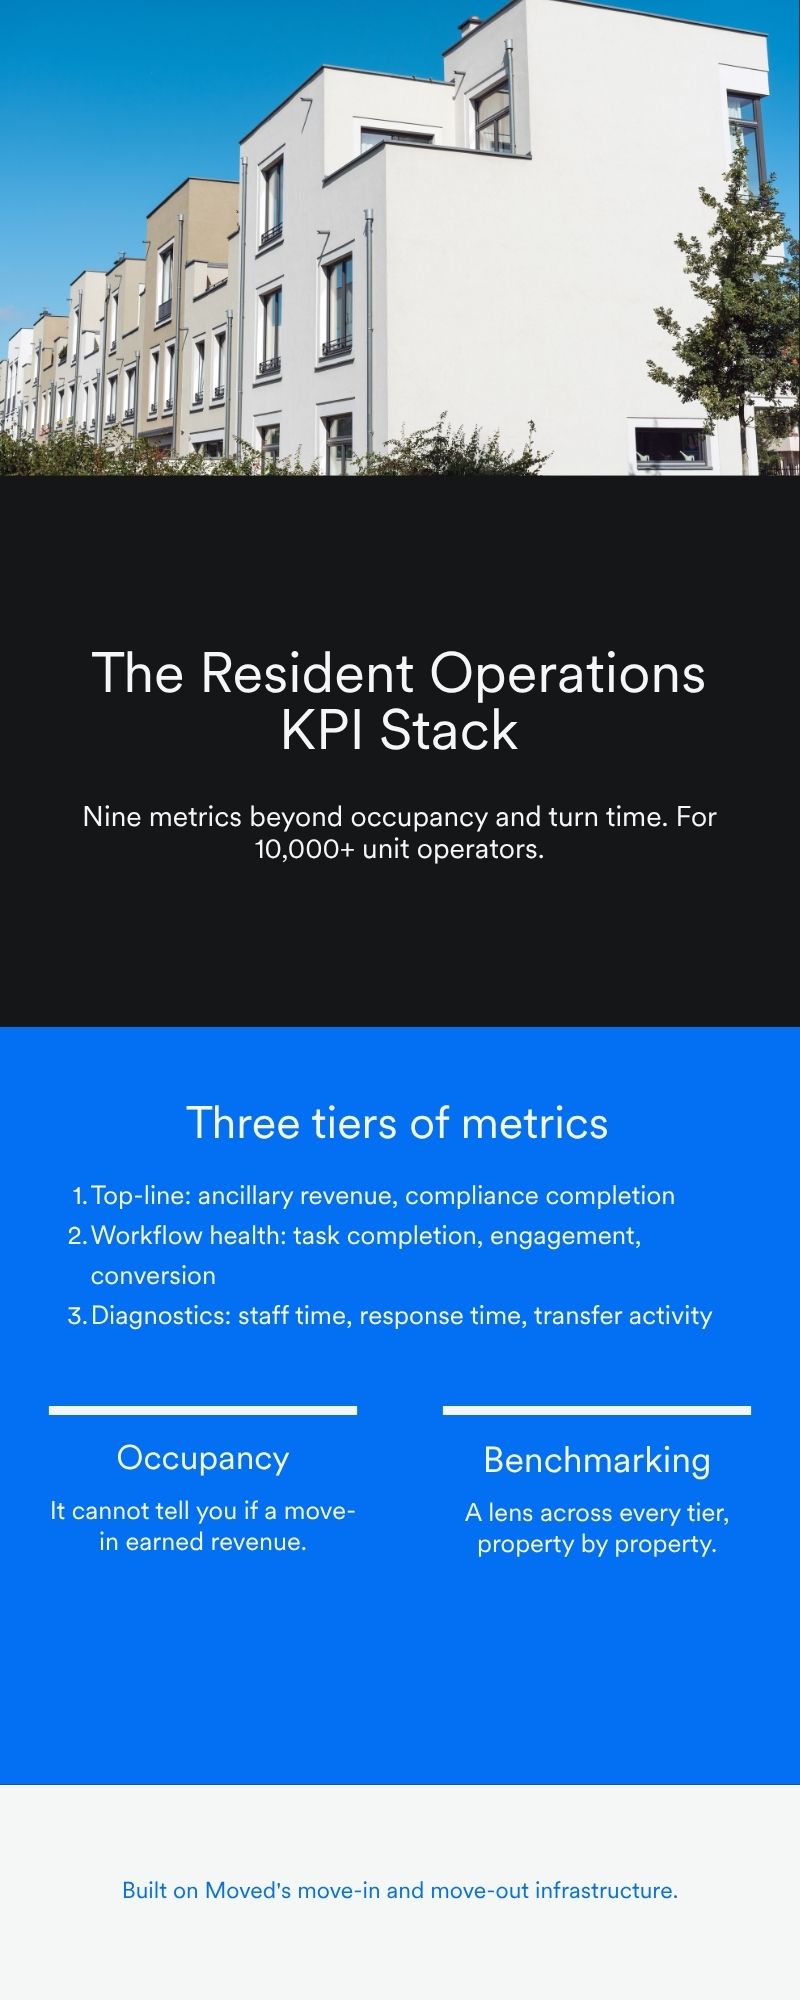
Assembling these nine metrics into a usable leadership dashboard does not require tracking every metric with equal weight. A practical rollout should:
- Lead the dashboard with ancillary revenue per move and compliance completion rate, consistent with a revenue-and-risk-first reporting hierarchy
- Group task completion, engagement, and move-event conversion together as workflow-health indicators supporting the top-line metrics
- Use staff time and resident response time as diagnostic metrics reviewed when a workflow-health indicator signals a problem
- Report transfer activity alongside ancillary revenue rather than as an isolated administrative line item
- Refresh portfolio benchmarking monthly, so underperforming properties are identified before a quarter closes rather than after
From occupancy dashboards to full operational visibility
Occupancy and turn time will always belong on a multifamily leadership dashboard, but they were never built to answer the operational questions that determine whether a portfolio is fully capturing the revenue and risk-mitigation value available at every move. A resident operations KPI stack anchored by ancillary revenue and compliance completion, supported by workflow-health and diagnostic metrics, and reviewed through portfolio benchmarking gives multifamily operators the visibility that financial and occupancy reporting alone cannot provide.
If your organization wants help building a resident operations dashboard tailored to your portfolio, reach out to the Moved team directly to talk through which metrics matter most for your properties.
Frequently asked questions
What KPIs should multifamily operations teams track?
Operations teams should track a stack of nine metrics beyond occupancy and turn time: task completion, engagement, move-event conversion, ancillary revenue, compliance completion, staff time, resident response time, transfer activity, and portfolio benchmarking, with ancillary revenue and compliance completion given the highest priority.
What are the most important resident operations metrics?
Ancillary revenue per move and compliance completion rate are the most important resident operations metrics, since they directly reflect revenue capture and liability exposure. Task completion, engagement, and move-event conversion are important supporting metrics that indicate whether the underlying workflow is functioning correctly.
How should operators measure move operations?
Move operations should be measured as a connected stack rather than isolated figures tracking task completion and engagement as workflow-health indicators, ancillary revenue and compliance completion as top-line outcomes, and staff time and resident response time as diagnostics, all reviewed through portfolio benchmarking to identify underperforming properties.