
At a 10,000+ unit operator, non-rent revenue from the move-in and move-out window is real money, and most asset management teams see it as a single bundled number called “other income.” That bundling is the fifth leak in the RevGen system: the reporting leak. When every stream collapses into one line, the team loses the ability to manage, and revenue you cannot see is revenue you cannot compound. The framing comes from the Moved CEO’s RevGen leak map.
This guide covers what the bundled line hides, the four-metric scorecard that replaces it, and why the move-in and move-out window is where the reporting leak costs the most. For the broader model, see our guide to ancillary revenue in multifamily.
What one bundled line hides
“Other income” treats a portfolio of distinct revenue streams- parking, pet rent, storage, utilities, insurance, and the partnership income that concentrates in the move-in and move-out window- as one undifferentiated bucket. A single number cannot tell the asset management team which streams are working, which are flat, where attach rates are strong, or where margin is thin. It reports a total while hiding every input that could improve it.
The result is that non-rent revenue drifts inside the line. A stream can fall for two quarters, and the bundled number barely moves, so nobody acts. The reporting leak is not a missing dollar; it is a missing signal.
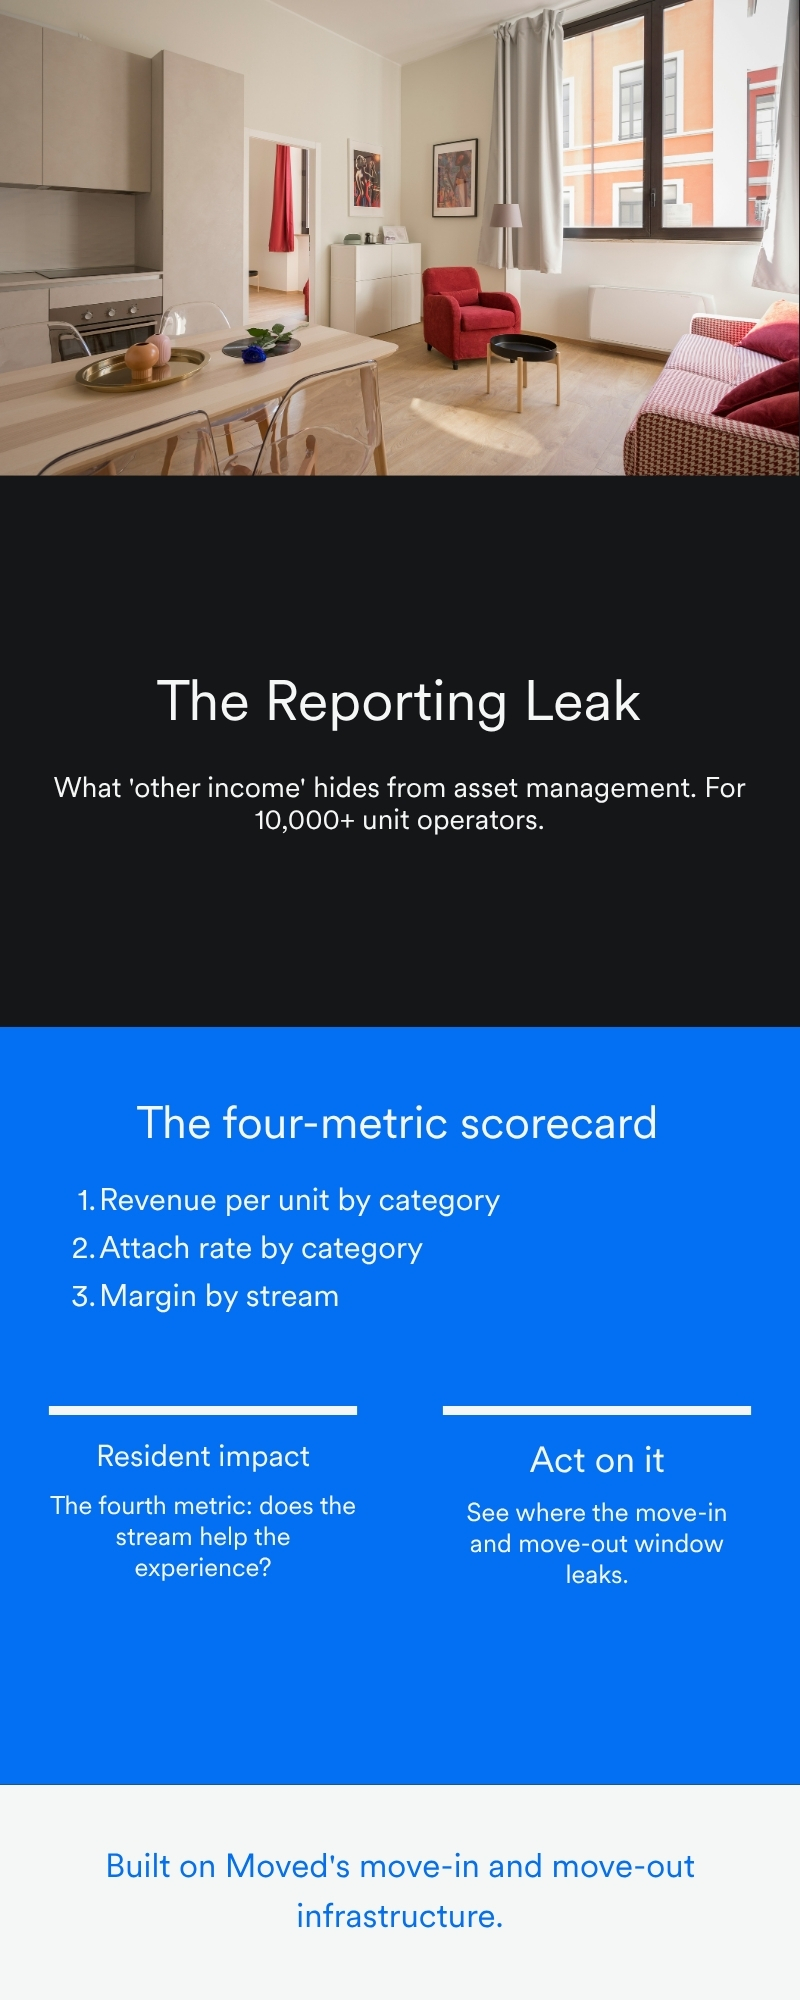
The four-metric scorecard
Closing the reporting leak means replacing the bundled line with a category-level scorecard the asset management team can act on.
- Revenue per unit by category. Break the total into its streams so each can be tracked and targeted individually.
- Attach rate by category. The share of residents who take each service is the truest measure of whether the move-in and move-out workflow is capturing the opportunity.
- Margin by stream. Not all revenue is equal, and partnership-based streams flow to NOI far more cleanly than others.
- Resident satisfaction impact. Whether a stream strengthens or strains the resident experience, revenue that erodes retention is not a win.
With those four visible, the team can see exactly where the move-in and move-out window is capturing revenue and where it is leaking, and can act on the specific stream rather than guessing at a total.
Why does the move-in and move-out window cost the most
The bundled line hides the highest revenue of all, because the move-in and move-out window is where the highest-intent, highest-margin non-rent revenue is concentrated. The Moved CEO’s RevGen leak map sizes the typically uncaptured non-rent opportunity at roughly $15 per unit per month, most of it in that window. When that revenue sits in “other income,” the team cannot even see whether it is being captured, which is why the reporting leak must be closed before the others can be managed. We walk through the mechanism in our breakdown of how move-in and move-out workflows became a property management revenue engine and the onboarding mechanics in our ultimate guide to resident onboarding automation.
How Moved fits
Moved is the move-in and move-out infrastructure platform that turns the bundled line into a scorecard. Traditional tools focus on task tracking and administrative coordination. Moved embeds revenue-generating services, including movers, packing, storage, utilities, internet, and insurance verification, directly into the resident workflow, then returns the results to the asset management team as category-level data by property, stream, attach rate, and margin. Resident perks, rewards, and partnerships run on Paylode, a Moved company that Moved acquired in November 2025 to advance ancillary revenue automation, per the Moved announcement. The resident-facing experience lives inside the Moved resident experience. Moved is built on flexible commercial structures designed to align with property financial goals.
To replace your bundled line with a category-level scorecard, book a walkthrough with our team or visit the Moved multifamily product page.
FAQs
What is the reporting leak in RevGen? It is the loss of signal that happens when non-rent revenue is bundled into a single “other income” line. The team can see a total, but none of the inputs needed to manage it.
Why is “other income” the wrong way to manage non-rent revenue? Because it collapses distinct streams into one number, hiding category performance, attach rate, margin, and resident impact.
What four metrics replace the bundled line? Revenue per unit by category, attach rate by category, margin by stream, and resident satisfaction impact.
Why does the move-in and move-out window matter most here? Because it holds the highest-intent, highest-margin non-rent revenue, and bundling hides whether that revenue is captured at all.
Who uses the scorecard? The asset management team, with on-site teams executing the workflow and the platform maintaining consistent data across the portfolio.
The bottom line
In residential real estate, you cannot compound what you cannot see. Replacing the bundled “other income” line with a four-metric scorecard- revenue per unit by category, attach rate, margin, and resident satisfaction impact- gives the asset management team the signal to manage non-rent revenue, starting with the move-in and move-out window where it matters most.
For the NOI picture, see our guide to increasing multifamily NOI without raising rent.